Indonesia demonstrated notable activity and substantial growth across various Intellectual Property (IP) domains in 2024, particularly in Utility Models (UM), Industrial Designs, and Trademarks, according to the World Intellectual Property Indicators 2025 report.
Indonesia is classified as an upper-middle-income economy. Its IP performance often reflects a surge in filings, especially when compared to other countries in similar income brackets or neighboring regions.
Patent Activity
Indonesia’s IP Office significantly advanced its global standing in Patent Applications in 2024:
- Office Ranking:
Indonesia rose one place to 17th among the world’s top 20 IP Offices. - Application Volume and Growth:
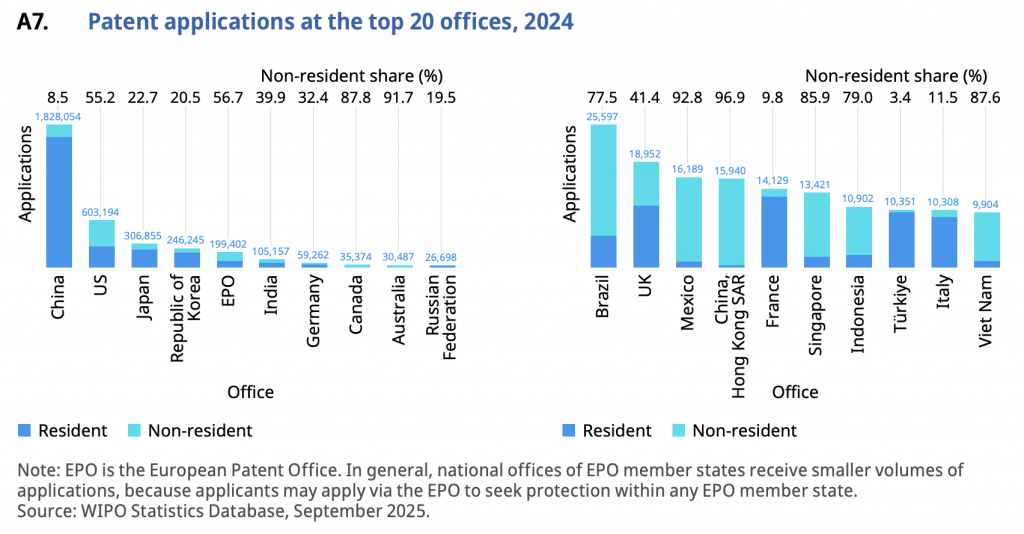
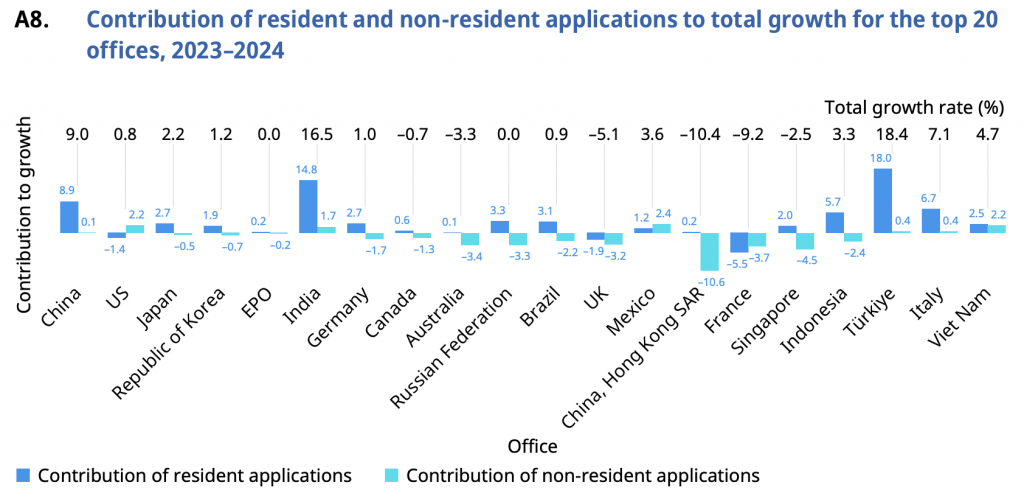
The Indonesian IP Office received 10,902 patent applications in 2024. This total represented a 3.3% growth rate from 2023. - Growth Drivers:
The overall growth was primarily driven by Non-Resident Applications, which contributed 2.9 percentage points to the total growth, while Resident Applications contributed 0.4 percentage points.
- Non-Resident Dependence:
Applications filed by Non-Resident Applicants accounted for a significant share of total applications received by Indonesia’s IP Office, comprising 79.0%. - Origin of Non-Resident Filings:
Applicants residing in Japan held the largest share of Non-Resident Filings in Indonesia, accounting for 23.6% of those applications. - Patent Grants:
In 2024, Indonesia granted 5,812 Patents. Similar to applications, Non-Resident Grants dominated, representing 89.3% of all Patents Granted.
Simple Patents or Utility Models (UM) Performance
 Indonesia stands out globally as a major source of utility model filings:
- Origin Rank and Volume:
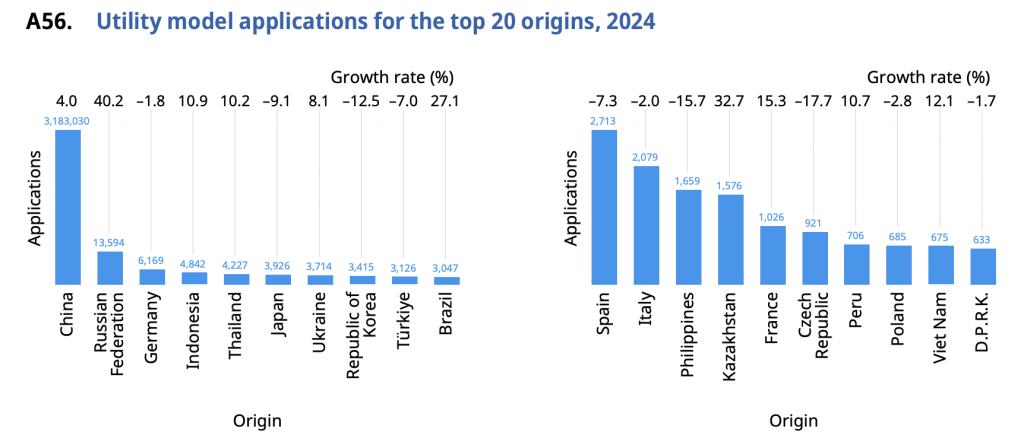
Applicants residing in Indonesia filed 4,842 UM applications in 2024, ranking Indonesia 4th worldwide! - Growth Rate:
Indonesia recorded a double-digit growth rate of +10.9% for UM applications by origin in 2024 compared to 2023. - Trend:
As a middle-income country, Indonesia saw a substantial increase in the volume of UM filings over the recent decade.
Trademark Activity
In Trademark filings, Indonesia showed strong domestic growth but displayed comparatively low intensity relative to its population size:
- Office Ranking and Volume:
Indonesia ranked 15th among the top 20 offices for Trademark Application class counts in 2024, receiving 166,118 counts. - Growth Driver (Office):
The Indonesian office experienced a total growth rate of 9.0% in Trademark application class counts (2023–2024), overwhelmingly driven by resident applications, which accounted for 8.6 percentage points of the increase. - Origin Growth:
As an origin, Indonesia recorded a considerable Trademark filing increase of +8.4% in 2024, which was driven by growth in both resident filing and applications filed abroad. - Filing Intensity (Per Capita):
Indonesia recorded one of the lowest ratios of resident Trademark application class counts per million population, ranging between approximately 350 and 730 classes per million population in 2024 (specifically, 353 per million population). - Industry Focus:
The Indonesian IP Office, along with those in China, India, and Viet Nam, reported the lowest share of applications related to service classes (ranging between 28% and 32%), indicating a focus on goods. Specifically, the share of services classes in Indonesia was 28.3%.
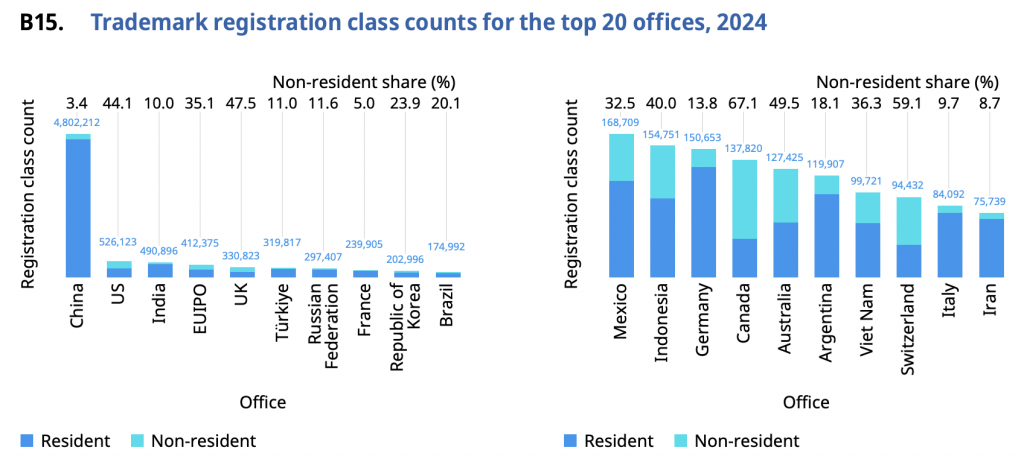
- Registration Class Counts:
The Indonesian office recorded 154,751 registration class counts in 2024. - Trademarks in Force:
A total of 897,580 trademark registrations were actively in force in Indonesia in 2024.
Industrial Design Activity
Indonesia was a leader in application design growth in 2024:
- Office Growth:
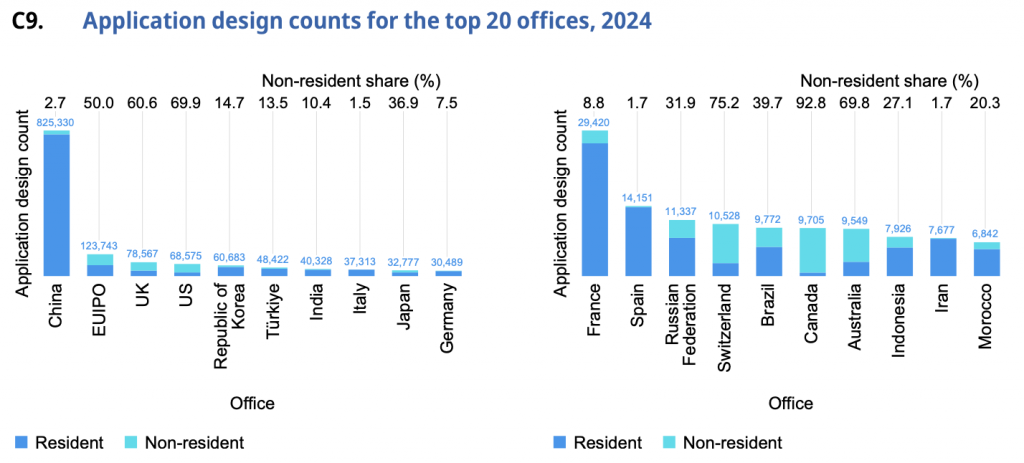
Indonesia’s office reported one of the largest growth rates among the top 20 offices, posting an increase of 25.3% in Application Design counts in 2024. This increase was primarily driven by resident applicants, who contributed 15.5 percentage points to the growth. Indonesia ranked 18th in total Application Design counts, receiving 7,926 counts. - Origin Growth:
Applicants residing in Indonesia recorded a pronounced increase in Industrial Design counts by origin, growing by +18.9% in 2024. - Filing Intensity (Per GDP):
Indonesia had a notably low ratio of resident design count per USD 100 billion of GDP, standing at 141. - Designs in Force:
The average age of design registrations in force in Indonesia was 4.5 years in 2024, the lowest reported among selected offices. - Development Level:
Indonesia was situated close to the typical trend line when comparing resident application design count per capita against GDP per capita (2020–2024), suggesting its design activity level is consistent with its economic development level.
Geographical Indications (GI)
Indonesia reported 182 Geographical Indications in force in 2024. All of these GIs were protected through a national sui-generis system, meaning 100% of the GIs in force were designated as National GIs.
Comparison of Indonesia’s IP Performance with Selected Peers (2024)
To better understand Indonesia’s performance, the table below compares its key metrics with other major upper-middle-income economies (Brazil, Türkiye) and regional neighbours (Thailand, Viet Nam, Philippines), focusing on application volumes and growth across Patents, Utility Models (UM), Trademarks, and Industrial Designs, as well as IP filing intensity relative to GDP.
| IP Indicator | Indonesia | Brazil | Türkiye | Thailand | Viet Nam | Philippines |
| Income Classification | Upper Middle | Upper Middle | Upper Middle | Lower Middle | Lower Middle | Upper Middle |
| Patent Apps (Office Total) | 10,902 (Rank 17th) | 25,597 (Rank 11th) | 10,351 (Rank 18th) | 8,727 | 9,904 | 4,571 |
| Patent Apps Growth (Office) | 3.3% | 0.9% | 18.4% | 1.4% | 4.7% | –6.5% |
| UM Apps (Origin Rank/Volume) | 4th (4,842) | 10th (3,047) | 9th (3,126) | 5th (4,227) | 19th (675) | 13th (1,659) |
| UM Apps Growth (Origin) | 10.9% | 27.1% | –7.0% | 10.2% | 12.1% | –15.7% |
| Trademark Apps (Office Class Count) | 166,118 (Rank 15th) | 468,667 (Rank 5th) | 399,023 (Rank 7th) | 73,552 | 126,733 (Rank 18th) | 67,868 |
| Trademark Apps Growth (Office) | 9.0% | 9.7% | 0.1% | 12.8% | 8.6% | 4.1% |
| Design Apps Growth (Office) | 25.3% | 27.3% | –16.6% | 19.4% | 20.2% | 40.1% |
| Resident Design Count per $100B GDP | 141 | 142 | 1,387 | 340 | N/A | N/A |
Key Comparative Insights
- Patent Focus:
Indonesia demonstrated resilience in its overall Patent Application growth (3.3%) and achieved a higher office ranking (17th). However, Indonesia remains highly dependent on non-resident filings (79.0% non-resident share), particularly from Japan (23.6%). In contrast, Viet Nam (9,904 applications) achieved faster overall Patent growth (4.7%), while Türkiye saw the highest growth (18.4%). - Utility Models Strength:
Indonesia is a major global player in Utility Model filing by origin, ranking 4th worldwide. This contrasts with its ASEAN neighbours like Thailand (5th) and the Philippines (13th). However, Brazil reported significantly faster UM growth at 27.1%. - Domestic Trademark Momentum:
While Brazil and Türkiye handle much higher volumes of Trademark Applications, Indonesia’s 9.0% growth rate was robust. Critically, Indonesia’s growth was overwhelmingly fueled by resident applicants (8.6 percentage points contribution), demonstrating strong domestic market activity. - Industrial Design Activity Surge:
Indonesia was one of the world’s leading offices for design growth (25.3%), comparable to Brazil (27.3%). The strongest design growth among peers, however, was recorded by the Philippines (40.1%). - Filing Intensity:
In terms of IP output relative to economic size (GDP) and population, Indonesia exhibits generally lower ratios compared to peers like Türkiye and Brazil, particularly in Industrial Designs and Trademarks. For instance, Indonesia’s resident design count per $100B GDP (141) is marginally below Brazil (142), but far below Türkiye (1,387).
The Indonesian IP landscape, therefore, shows high dynamism, marked by rapid expansion in its national registration capacity (especially in Utility Models and Industrial Designs) and strong domestic enthusiasm for Trademark registration, even though the country still relies heavily on foreign applicants for Patents.
Summary
Indonesia’s IP journey, as depicted in the 2025 WIPO report, is like a middle-distance runner who has found a burst of speed in certain segments of the race, specifically in designs and Utility Models. While it successfully moves up the rankings (like reaching 17th in Patents) and shows strong domestic momentum (especially in Trademarks), it still trails the overall pace setters in metrics adjusted for the size of its economy, indicating there is significant ground left to cover in translating broad economic activity into high-intensity Patent and Trademark creation per capita.
Should you need more information on IP landscape, protection, and registration in Indonesia, contact us through the channels below and get a FREE 15-minute consultation!
📩 E-Mail : [email protected]
📞 Book a Call : +62 21 83793812
💬 WhatsApp : +62 812 87000 889
Source: World Intellectual Property Indicators 2025
![[Reminder] Indonesia - Patent Working Statement to be Submitted Before 31 December 2025 - AFFA IPR](https://affa.co.id/global/wp-content/uploads/sites/10/2025/11/cover-patent-1-110x80.jpg)